最近的
Created using the Deedy - One Page Two Column ResumeLaTeX Template by Debarghya Das, from https://github.com/deedydas/Deedy-Resume. IMPORTANT: THIS TEMPLATE NEEDS TO BE COMPILED WITH XeLaTeX
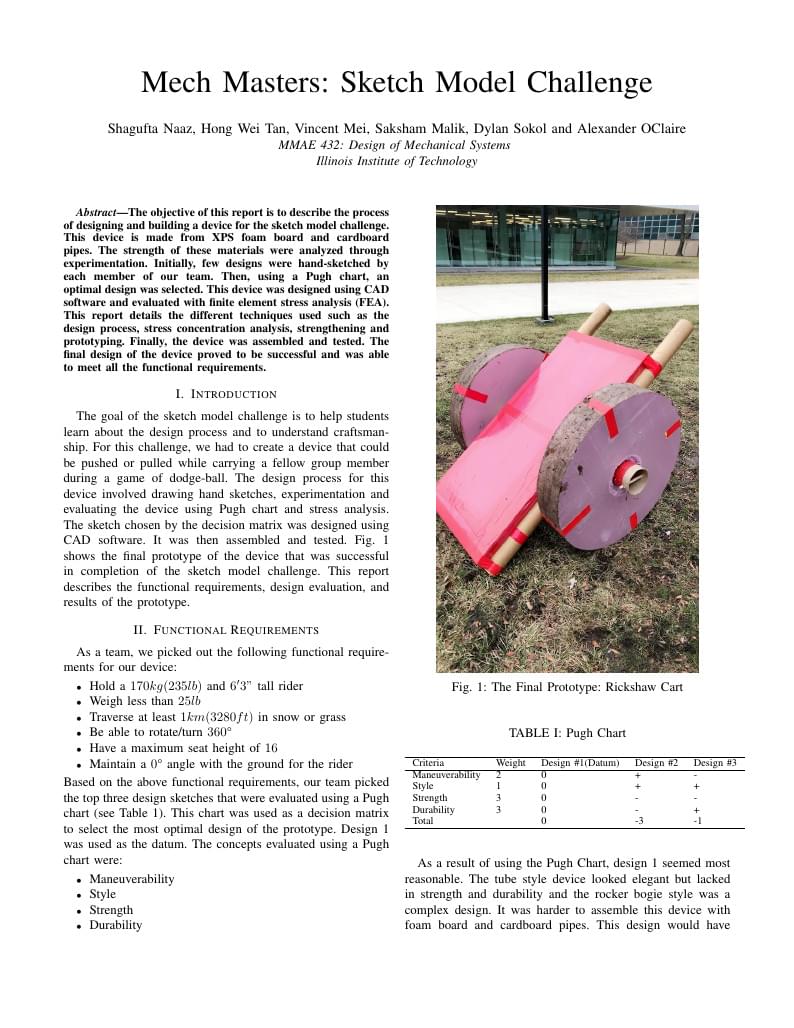
Design process of capstone senior "Sketch Model Challenge" project.
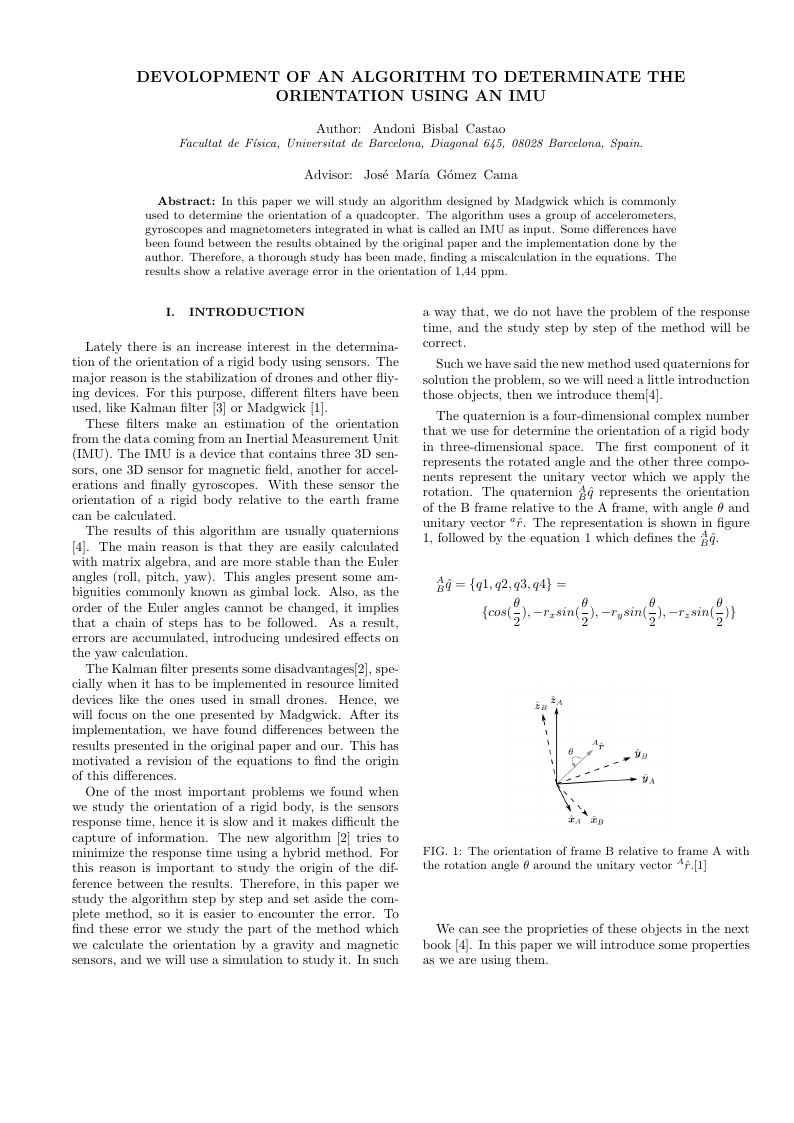
In this paper we will study an algorithm designed by Madgwick which is commonly used to determine the orientation of a quadcopter. The algorithm uses a group of accelerometers, gyroscopes and magnetometers integrated in what is called an IMU as input. Some differences have been found between the results obtained by the original paper and the implementation done by the author. Therefore, a thorough study has been made, finding a miscalculation in the equations. The results show a relative average error in the orientation of 1,44 ppm.
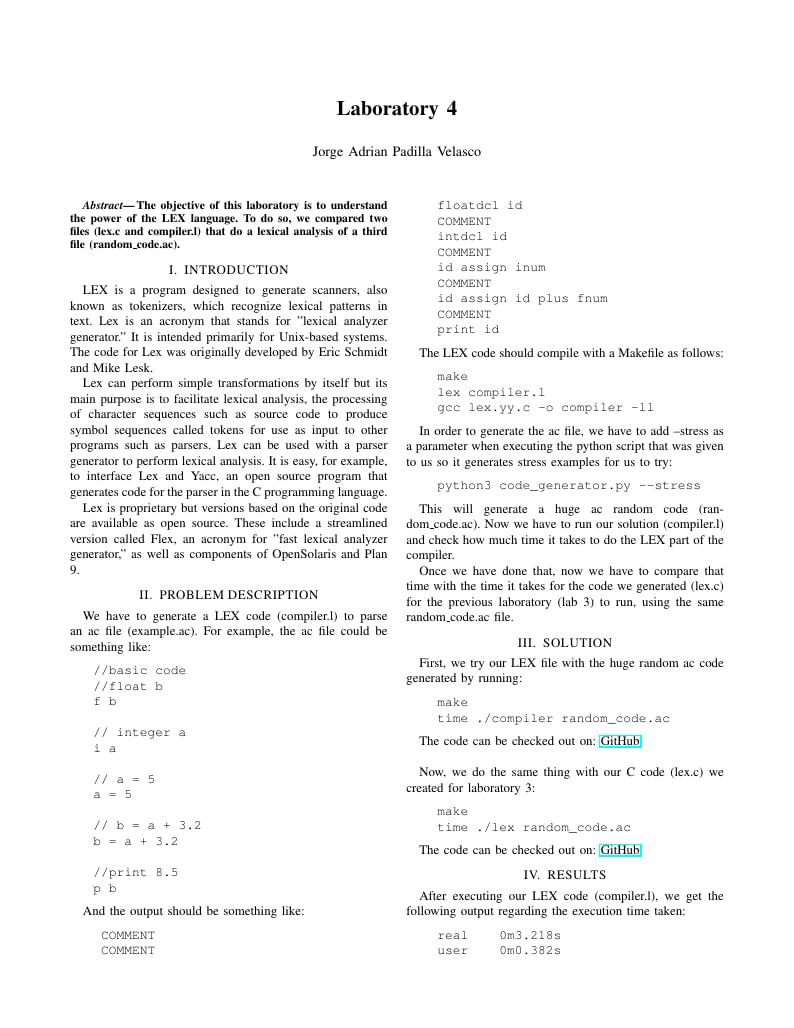
Laboratory where LEX is compared to C
This LaTeX tutorial will introduce LaTeX, creating a .tex file, sections, body text, tables, figures, mathematical formulas, acknowledgements, and references.
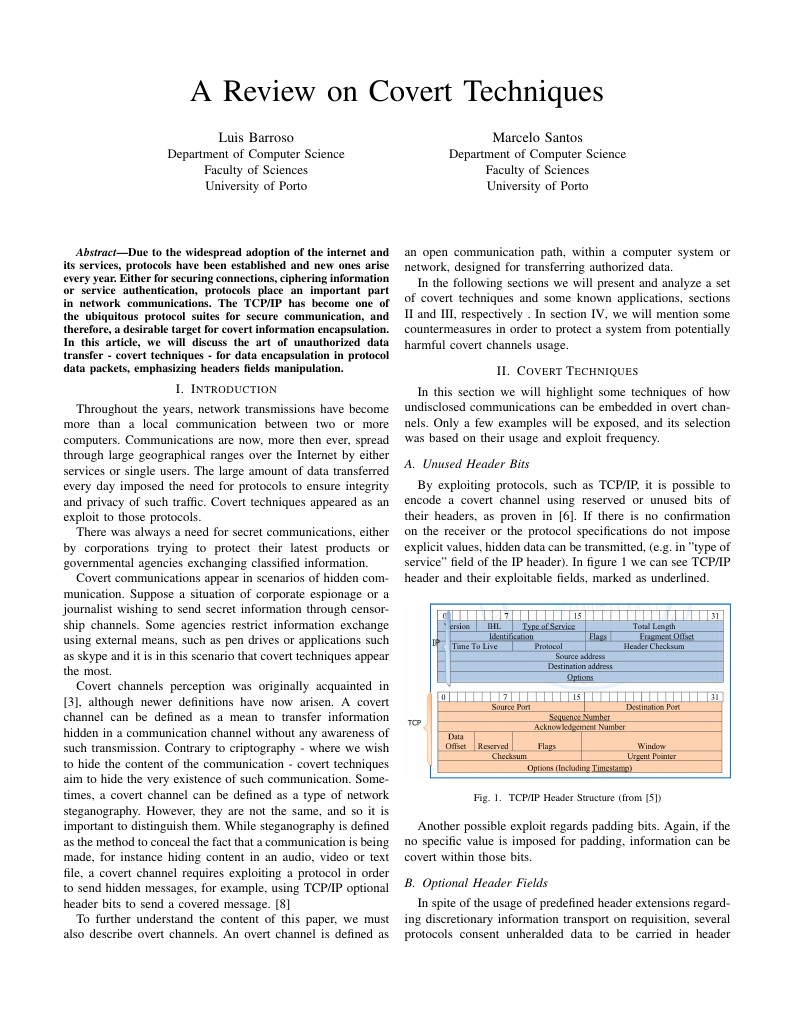
Due to the widespread adoption of the internet and its services, protocols have been established and new ones arise every year. Either for securing connections, ciphering information or service authentication, protocols place an important part in network communications. The TCP/IP has become one of the ubiquitous protocol suites for secure communication, and therefore, a desirable target for covert information encapsulation. In this article, we will discuss the art of unauthorized data transfer - covert techniques - for data encapsulation in protocol data packets, emphasizing headers fields manipulation.
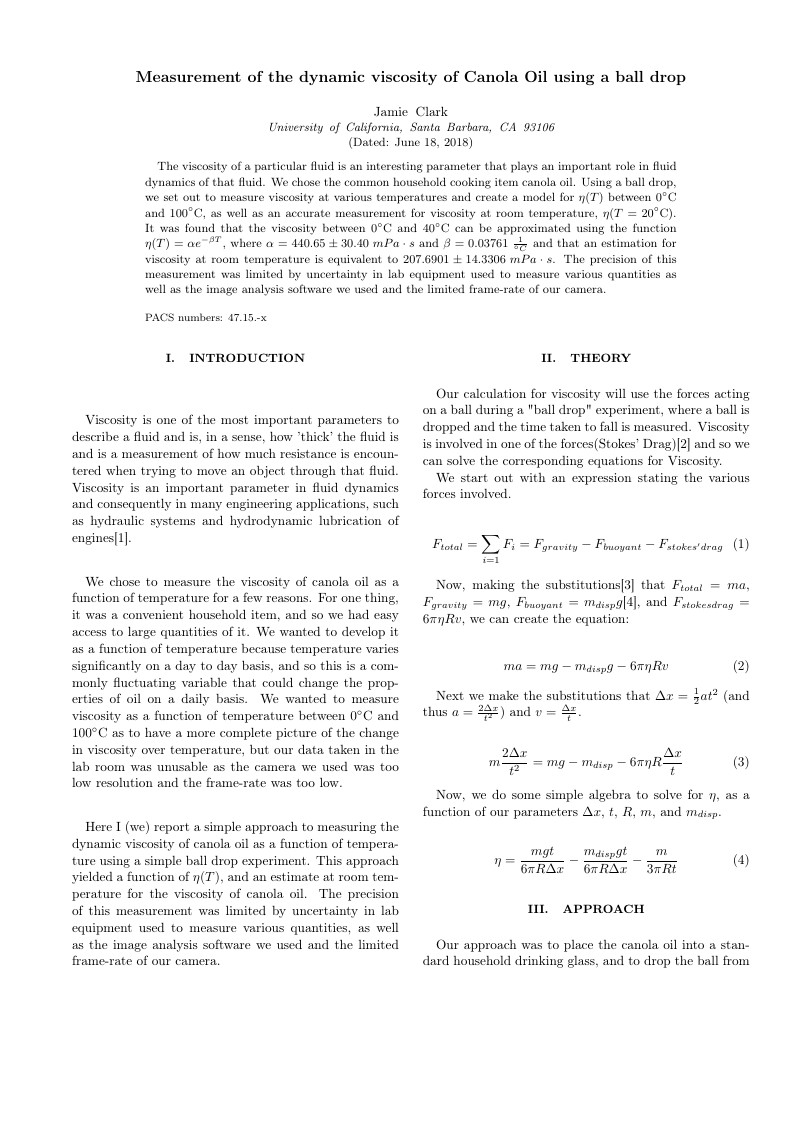
The viscosity of a particular fluid is an interesting parameter that plays an important role in fluid dynamics of that fluid. We chose the common household cooking item canola oil. Using a ball drop, we set out to measure viscosity at various temperatures and create a model for the viscosity of canola oil as a function of temperature, as well as an accurate measurement for viscosity at room temperature. It was found that the viscosity between 0 and 40 degrees Celsius can be approximated using an exponential function and that an estimation for viscosity at room temperature was not very difficult to obtain. The precision of this measurement was limited by uncertainty in lab equipment used to measure various quantities as well as the image analysis software we used and the limited frame-rate of our camera.
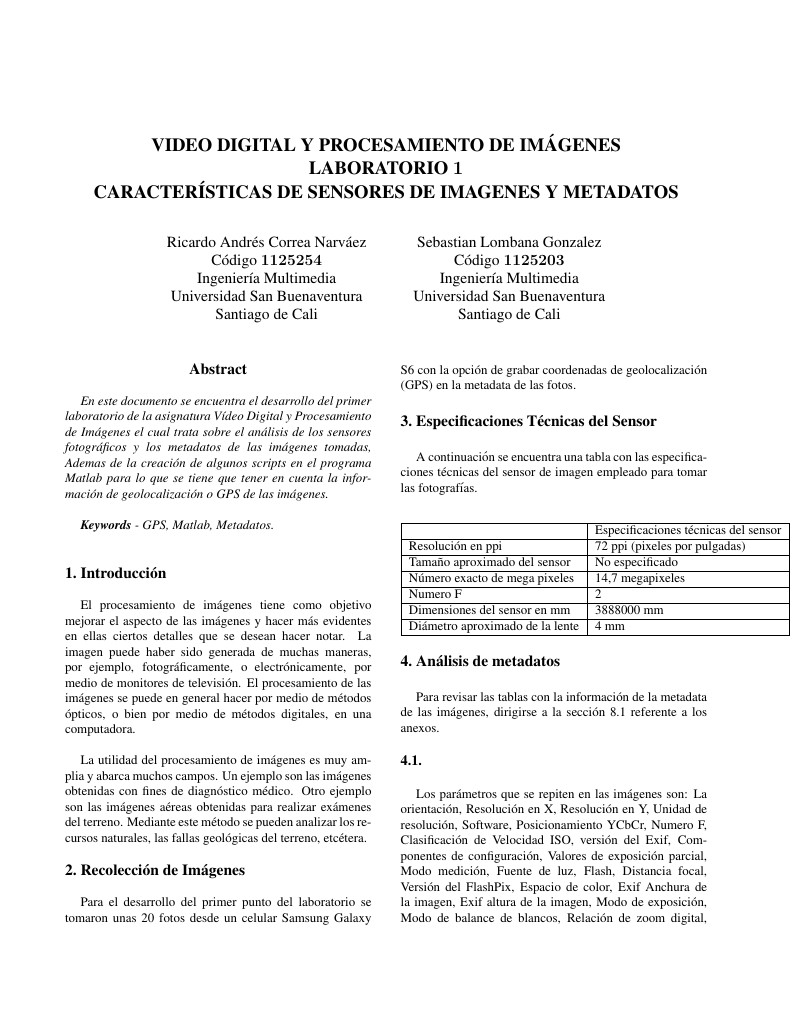
En este documento se encuentra el desarrollo del primer laboratorio de la asignatura Vídeo Digital y Procesamiento de Imágenes el cual trata sobre el análisis de los sensores fotográficos y los metadatos de las imágenes tomadas, Ademas de la creación de algunos scripts en el programa Matlab para lo que se tiene que tener en cuenta la información de geolocalización o GPS de las imágenes. Keywords — GPS, Matlab, Metadatos
Although the analysis of data is a task that has gained the interest of the statistical community in recent years and whose familiarity with the statistical computing environment, they encourage the current statistical community (to students and teachers of the area) to complete statistical analysis reproducible by means of the tool R. However for years there has been a gap between the calculation of matrices on a large scale and the term "big data", in this work the Normalized Cut algorithm for images is applied. Despite the expected, the R environment to do image analysis is poorly, in comparison with other computing platforms such as the Python language or with specialized software such as OpenCV. Being well known the absence of such function, in this work we share an implementation of the Normalized Cut algorithm in the R environment with extensions to programs and processes performed in C ++, to provide the user with a friendly interface in R to segment images. The article concludes by evaluating the current implementation and looking for ways to generalize the implementation for a large scale context and reuse the developed code. Key words: Normaliced Cut, image segmentation, Lanczos algorithm, eigenvalues and eigenvectors, graphs, similarity matrix, R (the statistical computing environment), open source, large scale and big data.