LaTeX can be used to produce a variety of different charts and diagrams, including: flowcharts, gantt charts, pie charts, branching and decision trees, family trees, histograms, bar charts and more. If you're looking for a particular type of chart that isn't featured here, please let us know, or submit your own example to the gallery.
最近的
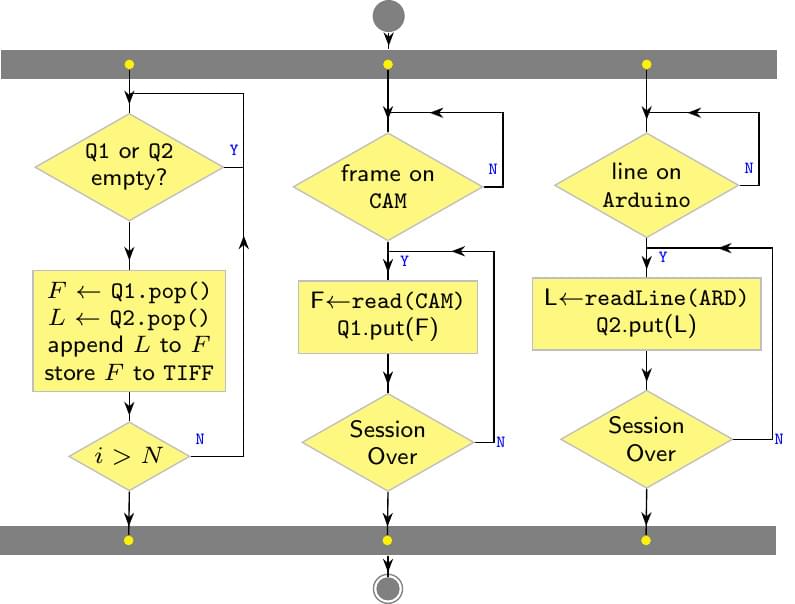
An example flowchart using Tikz/PGF.
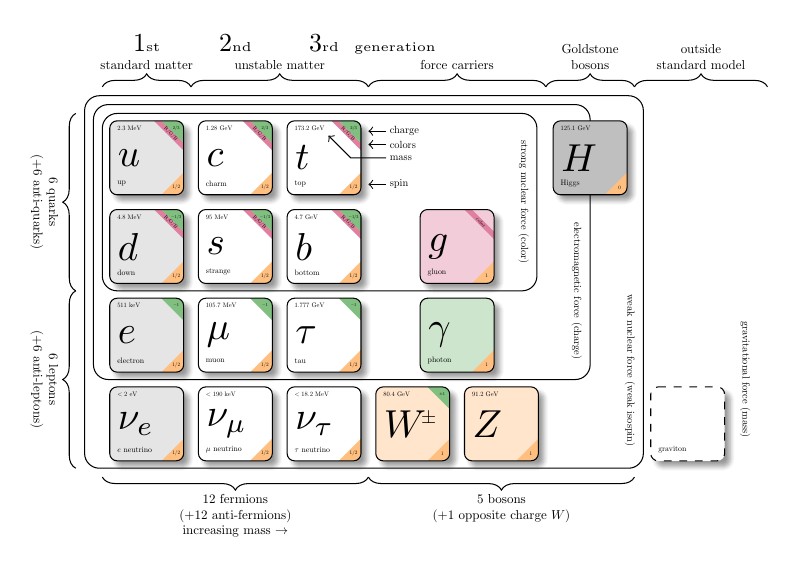
Chart of subatomic particles
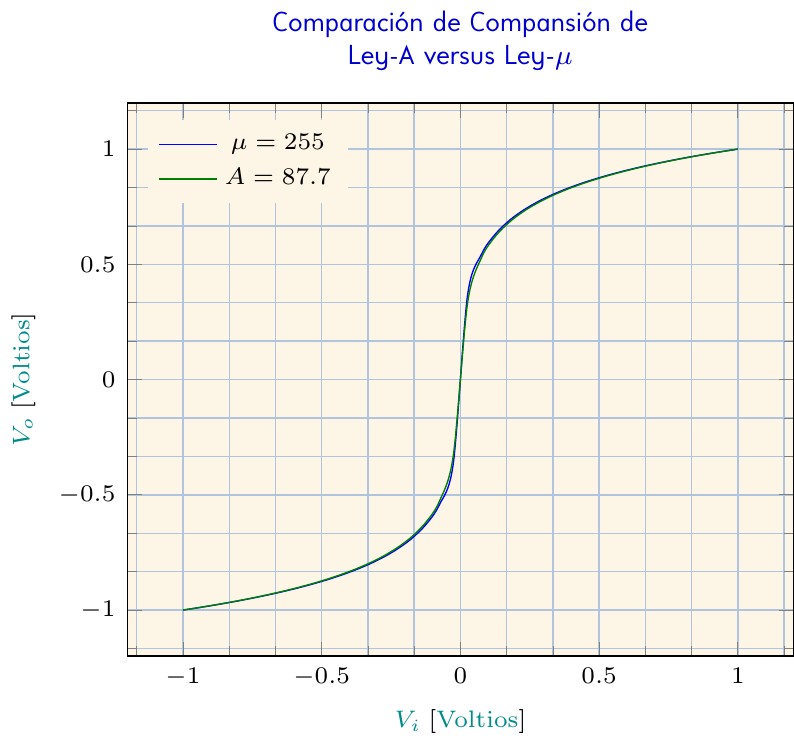
Este gráfico presenta las comparaciones de la compansión de una señal telefónica de entrada cuando es comprimida usando la Ley-A y la Ley-Mu tal se describen en la Recomendación G.711 de la Unión Internacional de Telecomunicaciones. De la gráfica se deduce que la compansión con ambas leyes no presenta mayores diferencias.
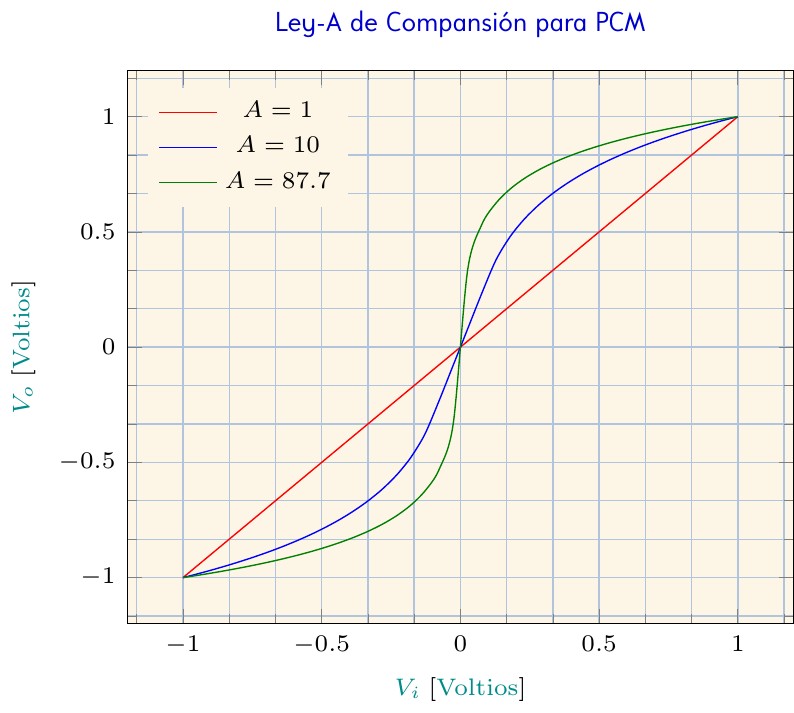
Este gráfico presenta las características de compresión de una señal telefónica de entrada cuando es comprimida usando la Ley-A tal como es descrita en la Recomendación G.711 de la Unión Internacional de Telecomunicaciones. Esta Ley es descrita por la siguiente ecuación: f(x)=sign(x)*\begin{cases} \displaystyle \frac{A\left |{x}\right |}{1+ln(A)} &\text{si} \, \displaystyle\left |{x}\right | < \frac{1}{A} \\ \\ \displaystyle \frac{1+ln(A\left |{x}\right |)}{1+ln(A)}&\text{si} \, \displaystyle \frac{1}{A} \leq\left |{x}\right |\leq 1 \end{cases}
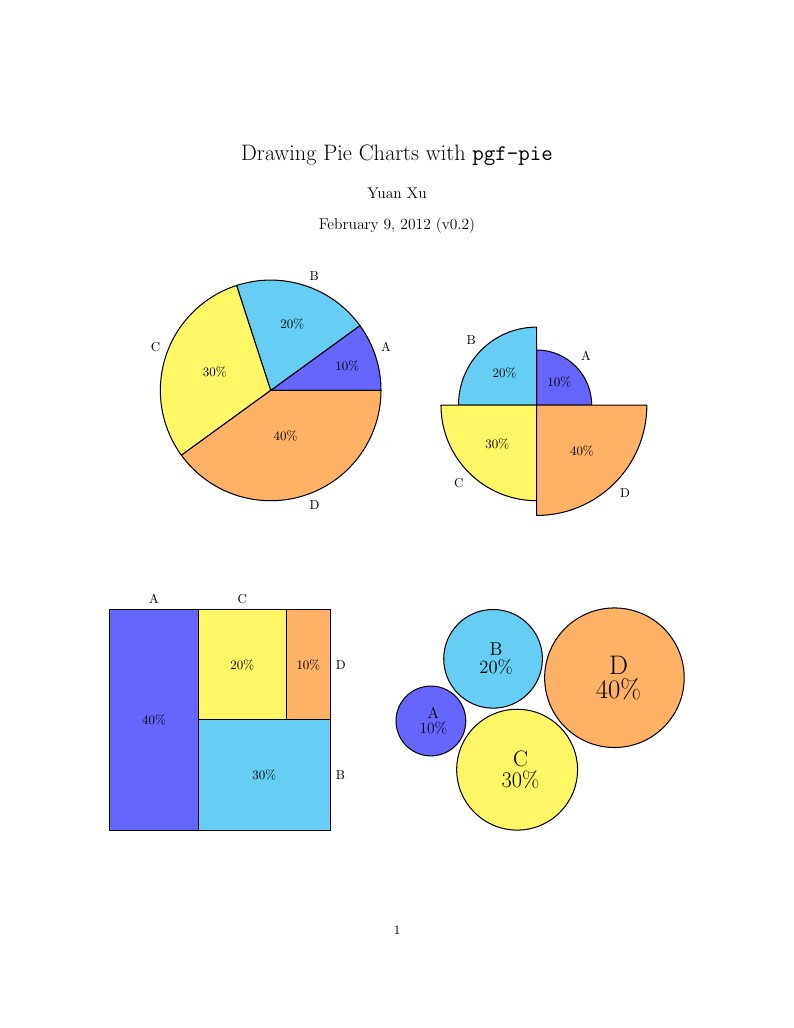
pgf-pie is a LaTeX package for drawing pie charts (and some interesting variants on pie charts) with the PGF/TikZ graphics package. The examples in this document are from the pgf-pie manual, version 0.2. The source code for pgf-pie is available at http://code.google.com/p/pgf-pie/.
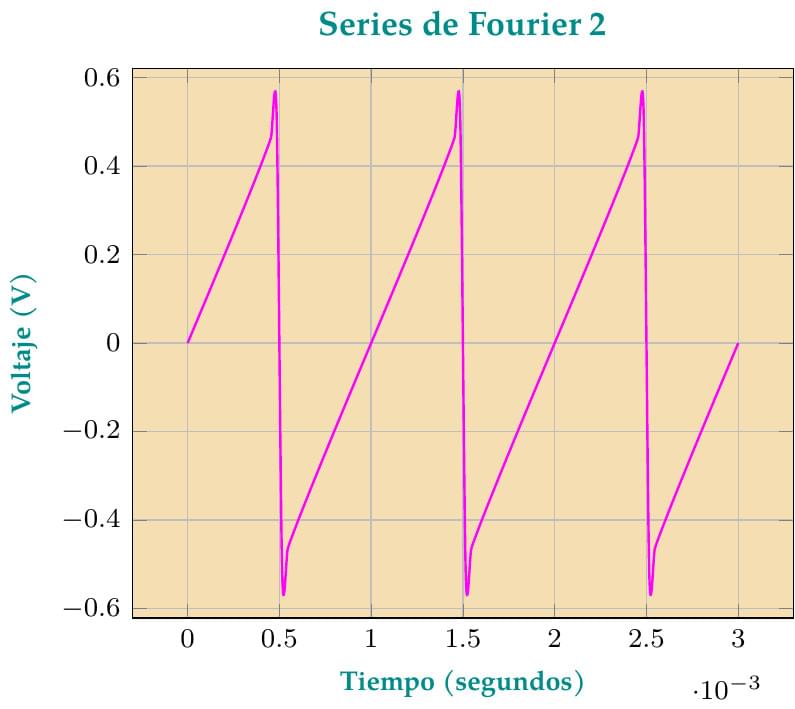
Este gráfico es una mejora, aprovechando el uso de GNUPLOT, de la primera versión que fue publicada por Overleaf. En este caso, la onda de "diente de sierra" es definida según lo indicado en el texto "Mathematical Handbook of Formulas and Tables" de la serie "Schaum's Outlines", de la editorial McGraw Hill, Quinta Edición, página 145. Para mayor precisión, son sumados los 100 primeros términos de la Serie de Fourier, lo cual no afecta grandemente el tiempo de compilación en los servidores de Overleaf.
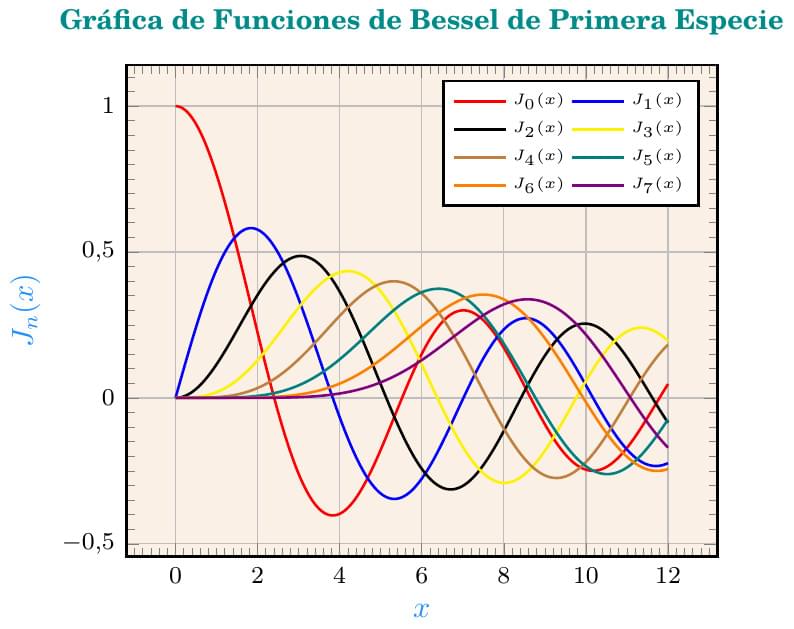
Este gráfico representa a las funciones de Bessel de primera especie, de las cuales fue publicada una primera versión por Overleaf con la diferencia de que, en lugar de usar el paquete GNUPLOTTEX, se usa el paquete PGFPLOTS con el software GNUPLOT, instalado en Overleaf.com, para calcular el trazado de ésta (y muchas otras curvas). Aunque PGFPLOTS es un paquete que produce gráficos de alta calidad, carece de rutinas breves y poderosas para el cálculo y graficación de funciones a partir de sumatorias, como sí tienen otros paquetes (como PSTRICK y GNUPLOT) , por lo que se usa la orden \addplot+[opciones_adicionales] gnuplot [raw gnuplot]{<órdenes de gnuplot>}, para indicar el dominio en el eje horizontal, la cantidad de muestras, la definición de la función de Bessel y la graficación (plot) de las 8 funciones en sus 50 primeros términos, variando solo el tamaño de "n" que determina el número de funciones a graficar. El gráfico presenta los valores "x" contra los valores de \(J_n(x)\) que representan a las funciones de Bessel de primera especie, trazado directamente sobre la cuadrícula dibujada mediante las rutinas de PGFPLOTS. En cada orden \addplot se define la n-ésima función de Bessel y se calcula la curva para cada valor particular de "n".
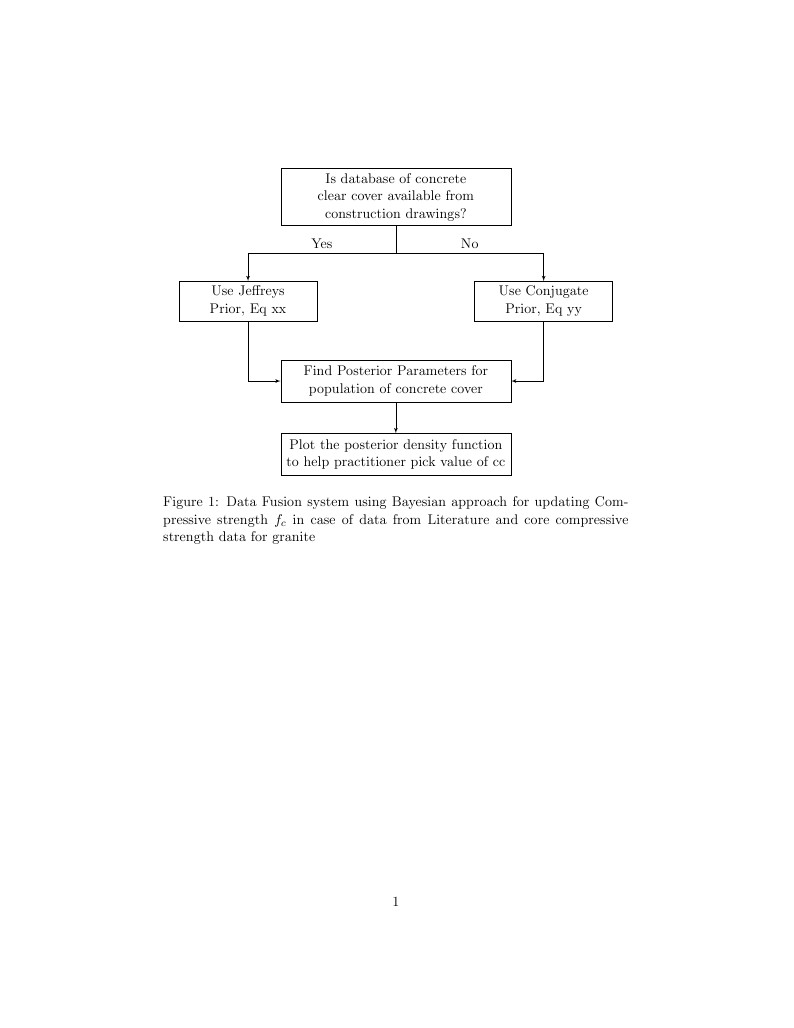
Branching arrows with decision option in flowchart
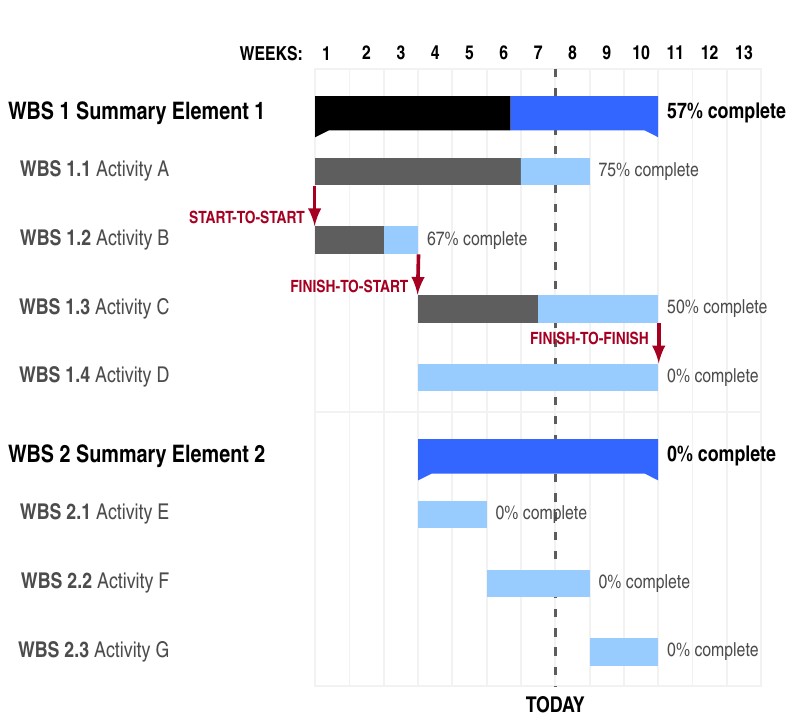
These examples show how to make Gantt charts for project planning in LaTeX with the pgfgantt package. They are from the package documentation. The pgfgantt package provides many useful macros for generating the calendar for the Gantt chart for either absolute or relative dates. It also provides macros for grouping and linking tasks, and for full control over the styling of the chart.