FRED/UF Homeworks template
作者:
Ariel Soto-Caro
最近上传:
7 年前
许可:
Creative Commons CC BY 4.0
摘要:
Template to be used in assignments, problem sets, etc. by graduate students of the Food and Resource Economics department, IFAS, University of Florida.
Template to be used in assignments, problem sets, etc. by graduate students of the Food and Resource Economics department, IFAS, University of Florida.
%% %%%%%%%%%%%%%%%%%%%%%%%%%%%%%%%%%%%%%%%%%%%%%%%%
%% Problem Set/Assignment Template to be used by the
%% Food and Resource Economics Department - IFAS
%% University of Florida's graduates.
%% %%%%%%%%%%%%%%%%%%%%%%%%%%%%%%%%%%%%%%%%%%%%%%%%
%% Version 1.0 - November 2019
%% %%%%%%%%%%%%%%%%%%%%%%%%%%%%%%%%%%%%%%%%%%%%%%%%
%% Ariel Soto-Caro
%% - asotocaro@ufl.edu
%% - arielsotocaro@gmail.com
%% %%%%%%%%%%%%%%%%%%%%%%%%%%%%%%%%%%%%%%%%%%%%%%%%
\documentclass[12pt]{article}
\usepackage{design_ASC}
\setlength\parindent{0pt} %% Do not touch this
%% -----------------------------
%% TITLE
%% -----------------------------
\title{Problem Set \#1} %% Assignment Title
\author{John Nash\\ %% Student name
AEB6933 - Fantastic Econometric Course\\ %% Code and course name
\textsc{University of Florida}
}
\date{\today} %% Change "\today" by another date manually
%% -----------------------------
%% -----------------------------
%% %%%%%%%%%%%%%%%%%%%%%%%%%
\begin{document}
\setlength{\droptitle}{-5em}
%% %%%%%%%%%%%%%%%%%%%%%%%%%
\maketitle
% --------------------------
% Start here
% --------------------------
% %%%%%%%%%%%%%%%%%%%
\section*{Question 1}
% %%%%%%%%%%%%%%%%%%%
{\bfseries You can write the questions here \ldots}
And your answers here \ldots
% %%%%%%%%%%%%%%%%%%%
\subsection*{Question 1.a}
% %%%%%%%%%%%%%%%%%%%
{\bfseries Also, you can write your sub-questions into subsection levels.}
And again, your answers here \ldots
% %%%%%%%%%%%%%%%%%%%
\section*{Mathematical notation}
% %%%%%%%%%%%%%%%%%%%
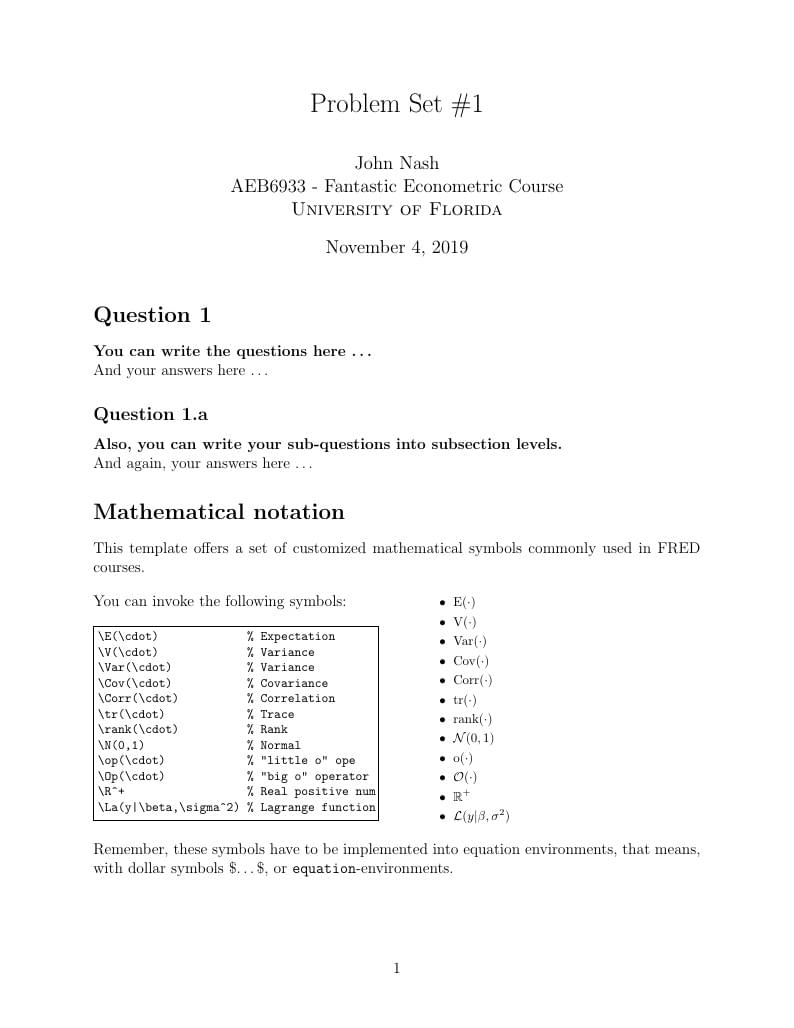
This template offers a set of customized mathematical symbols commonly used in FRED courses.
\begin{multicols}{2}
You can invoke the following symbols:
\begin{Verbatim}[frame=single, fontsize=\footnotesize]
\E(\cdot) % Expectation
\V(\cdot) % Variance
\Var(\cdot) % Variance
\Cov(\cdot) % Covariance
\Corr(\cdot) % Correlation
\tr(\cdot) % Trace
\rank(\cdot) % Rank
\N(0,1) % Normal
\op(\cdot) % "little o" ope
\Op(\cdot) % "big o" operator
\R^+ % Real positive num
\La(y|\beta,\sigma^2) % Lagrange function
\end{Verbatim}
\footnotesize{
\begin{itemize} \setlength\itemsep{0em}
\item $\E(\cdot)$
\item $\V(\cdot)$
\item $\Var(\cdot)$
\item $\Cov(\cdot)$
\item $\Corr(\cdot)$
\item $\tr(\cdot)$
\item $\rank(\cdot)$
\item $\N(0,1)$
\item $\op(\cdot)$
\item $\Op(\cdot)$
\item $\R^{+}$
\item $\La(y|\beta,\sigma^2)$
\end{itemize}}
\end{multicols}
Remember, these symbols have to be implemented into equation environments, that means, with dollar symbols \$\ldots\$, or \texttt{equation}-environments.
\newpage
There is a set of different accents you may use:
\begin{Verbatim}[frame=single, fontsize=\footnotesize]
$\hat \beta$, $\widehat \beta$, $\tilde \alpha$, $\widetilde \alpha$, $\bar y$,
$\varepsilon \sim \chi^2_t$
\end{Verbatim}
Which reproduce the following: $\hat \beta$, $\widehat \beta$, $\tilde \alpha$, $\widetilde \alpha$, $\bar y$, $\varepsilon \sim \chi^2_t$.
These are a couple of examples:
\begin{equation}
\Avar (b) = \frac{\sigma^2}{n} Q^{-1} \plim \left( \frac{1}{n}X'QX \right)Q^{-1}
\end{equation}
\begin{equation}
\sqrt{n}(b-\beta) \stackrel{d}{\longrightarrow} \N \left[0,\frac{\sigma^2}{n} Q^{-1} \plim \left( \frac{1}{n}X'\Omega X\right)Q^{-1}\right]
\end{equation}
% %%%%%%%%%%%%%%%%%%%
\section*{Code and scripts}
% %%%%%%%%%%%%%%%%%%%
If you want to print the raw outcomes from any software, it is recommended the \texttt{Verbatim}-environment :
%% Verbatim -----------------
\begin{Verbatim}[frame = single, fontsize = \footnotesize]
Parameters Estimates Std. err. Est./s.e. Prob. Gradient
------------------------------------------------------------------
P01 -0.5553 0.1446 -3.840 0.0001 0.0002
P02 -0.2255 0.1106 -2.039 0.0414 -0.0004
P03 -0.8588 0.2378 -3.612 0.0003 -0.0003
\end{Verbatim}
%% Verbatim -----------------
The same environment can be used for print a chunk of code (this is GAUSS by the way):
%% Verbatim -----------------
\begin{Verbatim}[frame = single, fontsize = \footnotesize]
ev = ev1 ~ ev2;
ev1 = sumc(ev[.,nest1]');
ev2 = sumc(ev[.,nest2]');
num = (ev1 .^ (k[1]-1)).*sumc(depm[.,nest1]') + (ev2 .^ (k[2]-1)).*sumc(depm[.,nest2]');
p = sumc((ev .* depm)').* num ./ ((ev1.^k[1])+(ev2.^k[2]));
\end{Verbatim}
%% Verbatim -----------------
If you want to print Stata-code, you can use the environment \texttt{lstlisting}, setting the \texttt{style} in \texttt{stata-editor}. This will highlight the Stata commands like the following example:
%% Stata-code -----------------
\begin{lstlisting}[language = Stata, style = stata-editor]
clogit depvar var1 var2 var3, group(id)
\end{lstlisting}
%% Stata-code -----------------
The same \texttt{lstlisting}-package can be used to print \textbf{R}-code, setting the only argument (\texttt{language}) in \texttt{R}.
%% R-code -----------------
\begin{lstlisting}[language = R]
Quad.reg <- function(z) {
grad <- cbind(z[4]+z[11]*m[1]+z[15]*m[2]+z[25]*m[3]+z[19]*m[4]+z[20]*m[5]+z[21]*m[6],
z[5]+z[12]*m[1]+z[16]*m[2]+z[19]*m[3]+z[26]*m[4]+z[22]*m[5]+z[23]*m[6],
z[7]+z[14]*m[1]+z[18]*m[2]+z[21]*m[3]+z[23]*m[4]+z[22]*m[5]+z[28]*m[6])
test1 <- min(grad) # have to be >0
test2 <- max(eigen(hess)$values) # have to be < 0
if(Mode == 1) {
lst <- list(Grad = grad, Hess = hess, Test1 = test1, Test2 = test2)
return(lst)
} else {
return(cbind(test1,test2))
}
}
\end{lstlisting}
%% R-code -----------------
\end{document}