![PSTricks LaTeX Example 5: Graphing a trig function](https://writelatex.s3.amazonaws.com/published_ver/601.jpeg?X-Amz-Expires=14400&X-Amz-Date=20240701T022031Z&X-Amz-Algorithm=AWS4-HMAC-SHA256&X-Amz-Credential=AKIAWJBOALPNFPV7PVH5/20240701/us-east-1/s3/aws4_request&X-Amz-SignedHeaders=host&X-Amz-Signature=b91095c462656e00ee9553f7bdf13769bbef4041bfa9e1a054885dbcb70df285)
PSTricks LaTeX Example 5: Graphing a trig function
作者
最近上传
10 年前
许可
Other (as stated in the work)
摘要
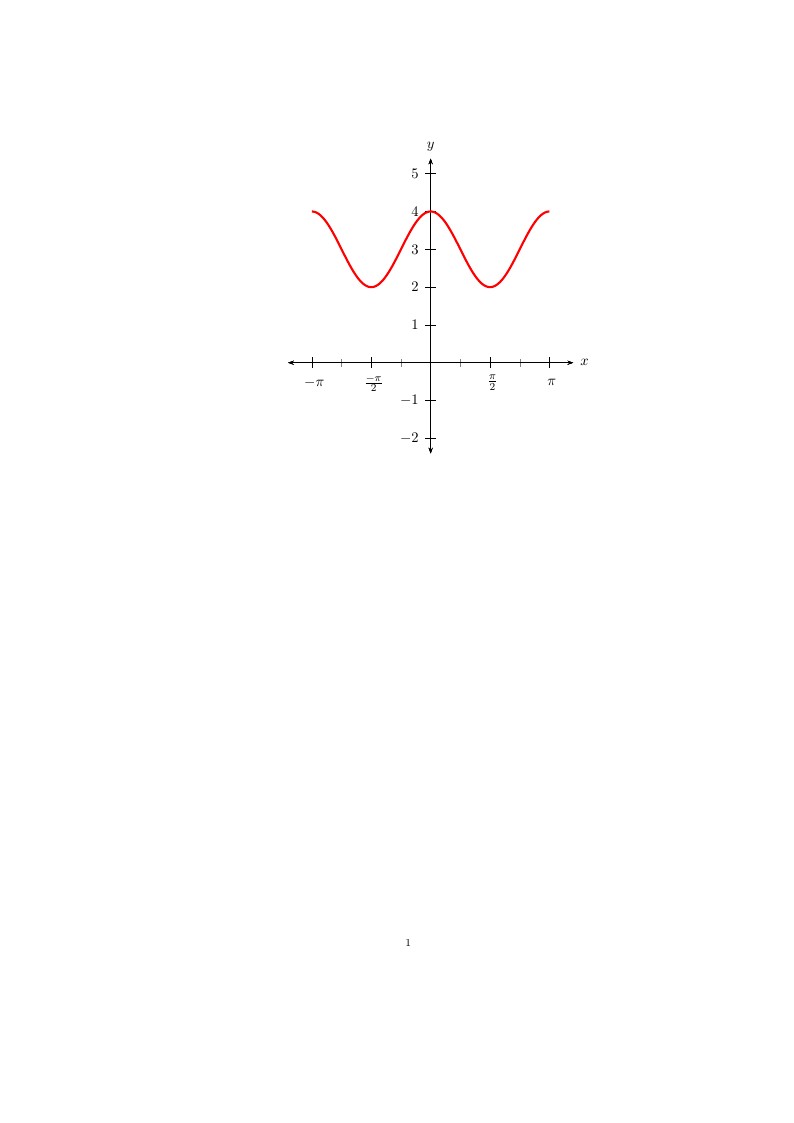
Following on from example 4 which showed how to plot the graph of a function in LaTeX using pstricks, here we extend the example to show how trig functions such as cos, sin and tan can be plotted.
Original source: http://www.thelazymathematician.com/p/pstricks-examples.html
![PSTricks LaTeX Example 5: Graphing a trig function](https://writelatex.s3.amazonaws.com/published_ver/601.jpeg?X-Amz-Expires=14400&X-Amz-Date=20240701T022031Z&X-Amz-Algorithm=AWS4-HMAC-SHA256&X-Amz-Credential=AKIAWJBOALPNFPV7PVH5/20240701/us-east-1/s3/aws4_request&X-Amz-SignedHeaders=host&X-Amz-Signature=b91095c462656e00ee9553f7bdf13769bbef4041bfa9e1a054885dbcb70df285)