LaTeX codes for line charts
\documentclass[12pt]{article}
\usepackage[utf8]{inputenc}
\usepackage{graphicx}
\usepackage{pgfplots}
\pgfplotsset{compat=1.14}
%enter the data sets as follows.
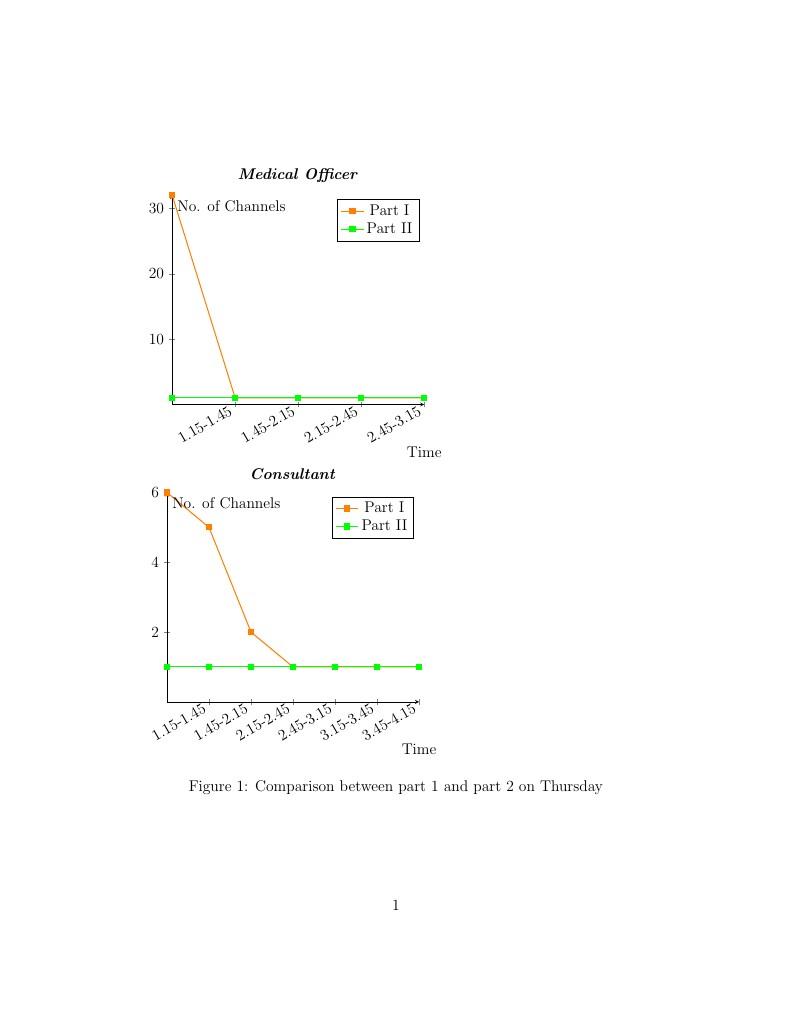
\begin{filecontents}{thu2.dat}
X Time Part1 Part2
1 12.45-1.15 32 1
2 1.15-1.45 1 1
3 1.45-2.15 1 1
4 2.15-2.45 1 1
5 2.45-3.15 1 1
\end{filecontents}
\begin{filecontents}{thu3.dat}
X Time Part1 Part2
1 12.45-1.15 6 1
2 1.15-1.45 5 1
3 1.45-2.15 2 1
4 2.15-2.45 1 1
5 2.45-3.15 1 1
6 3.15-3.45 1 1
7 3.45-4.15 1 1
\end{filecontents}
\begin{document}
\begin{figure}[h!]
\begin{tikzpicture}
\begin{axis}[
axis lines=middle,
ymin=0,
x label style={at={(current axis.right of origin)},anchor=north, below=10mm},
title={\textit{\textbf{Medical Officer}}},
xlabel=Time,
ylabel=No. of Channels,
xticklabel style = {rotate=30,anchor=east},
enlargelimits = false,
xticklabels from table={thu2.dat}{Time},xtick=data]
\addplot[orange,thick,mark=square*] table [y=Part1,x=X]{thu2.dat};
\addlegendentry{Part I}
\addplot[green,thick,mark=square*] table [y= Part2,x=X]{thu2.dat};
\addlegendentry{Part II}]
\end{axis}
\end{tikzpicture}
\begin{tikzpicture}
\begin{axis}[
axis lines=middle,
ymin=0,
x label style={at={(current axis.right of origin)},anchor=north, below=10mm},
title={\textbf{\textit{Consultant}}},
xlabel=Time,
ylabel=No. of Channels,
xticklabel style = {rotate=30,anchor=east},
enlargelimits = false,
xticklabels from table={thu3.dat}{Time},xtick=data]
\addplot[orange,thick,mark=square*] table [y=Part1,x=X]{thu3.dat};
\addlegendentry{Part I}
\addplot[green,thick,mark=square*] table [y= Part2,x=X]{thu3.dat};
\addlegendentry{Part II}
\end{axis}
\end{tikzpicture}
\caption{Comparison between part 1 and part 2 on Thursday}
\end{figure}
\end{document}