Figures TikZ du cours "Forces centrales"
作者:
Jimmy Roussel
最近上传:
11 年前
许可:
Creative Commons CC BY 4.0
摘要:
Codes TikZ des figures du cours "Mouvememnts à force centrale" situé à l'adresse : http://www.femto-physique.fr/mecanique/meca_C7.php

Codes TikZ des figures du cours "Mouvememnts à force centrale" situé à l'adresse : http://www.femto-physique.fr/mecanique/meca_C7.php

% Ce document regroupe les codes TIKZ des figures utilisées pour le cours "forces centrales" situé à la page http://femto-physique.fr/mecanique/xxxx.php

%-------------------------------------------
\documentclass[11pt]{article}
\input{styles_meca}
\title{Figures TikZ du cours "Forces centrales"}
\begin{document}
% ==========================================
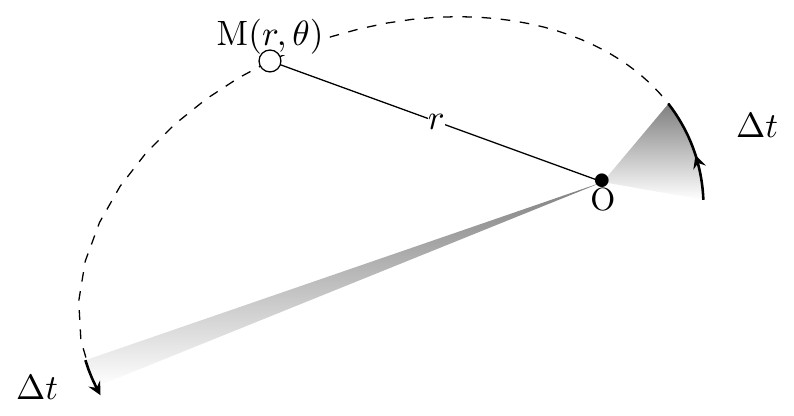
%  Loi des aires : pour des durées égales, l'aire balayée par le rayon vecteur est la même
% ==========================================
\begin{tikzpicture}[scale=1.2,decoration={markings,mark=at position 5mm with {\arrow[black]{stealth};}}]
% \shorthandoff{:}
\def \parametre {1.5};%parametre
\def \alphaM {160};%angle correspondant au point M
\def \alphaP {20};%angle correspondant au périgée
\def \excentric {0.7};%excentricité
\draw[dashed,variable=\t , domain=0:201,samples=50] plot ({\parametre*cos(\t)/(1+\excentric*cos(\t-\alphaP))},{\parametre*sin(\t)/(1+\excentric*cos(\t-\alphaP))});
\shade[variable=\t ,domain=-10:50,samples=20] plot ({\parametre*cos(\t)/(1+\excentric*cos(\t-\alphaP))},{\parametre*sin(\t)/(1+\excentric*cos(\t-\alphaP))})--(0,0)--cycle;
\draw[postaction={decorate},thick,variable=\t , domain=-10:50,samples=20] plot ({\parametre*cos(\t)/(1+\excentric*cos(\t-\alphaP))},{\parametre*sin(\t)/(1+\excentric*cos(\t-\alphaP))});
\shade[variable=\t ,domain=199:202,samples=5] plot ({\parametre*cos(\t)/(1+\excentric*cos(\t-\alphaP))},{\parametre*sin(\t)/(1+\excentric*cos(\t-\alphaP))})--(0,0)--cycle;
\draw[->,thick,variable=\t , domain=199:203,samples=5] plot ({\parametre*cos(\t)/(1+\excentric*cos(\t-\alphaP))},{\parametre*sin(\t)/(1+\excentric*cos(\t-\alphaP))});
\coordinate (M) at ({\parametre*cos(\alphaM)/(1+\excentric*cos(\alphaM-\alphaP))},{\parametre*sin(\alphaM)/(1+\excentric*cos(\alphaM-\alphaP))});
\draw (0,0) node{$\bullet$} node[below]{\small O}--(M) node[above,fill=white]{M$(r,\theta)$}node[pos=0.5,fill=white]{$r$};
\draw[fill=white] (M) circle(0.1);
\draw (20:1.5) node{$\Delta t$};
\draw (200:5.5) node{$\Delta t$};
\end{tikzpicture}

% ==========================================
%  Exemple de profil énergétique à un puits.
% Suivant la valeur de l’énergie mécanique, les valeurs de $r$ sont bornées ou pas.
% ==========================================
\begin{tikzpicture}[scale=1]
\def \xLabel {$r$}; % legende sur x
\def \yLabel {$E_{\textrm{p,\,eff}}$}; % legende sur y
\def \xmin{0};
\def \xmax{7};
\def \ymin{-2};
\def \ymax{3};
\draw[thin,gray] (7,0.6)--++(-7,0) node[left]{$E_{\textrm{m}}$};
\draw[thick] (0.8,0.6)--++(2.05,0) node[pos=0.5, above]{\small \'etats li\'es};
\draw[thick] (4.5,0.6)--++(2.5,0) node[pos=0.5, above]{\small \'etats non li\'es};
\draw[thick,color=blue, variable=\x, samples at={0.7,0.75,...,\xmax}] plot ({\x}, {5/(\x*\x)-(10*sin(1.1*\x r)*exp(-0.4*\x))/(\x)}) ;
\draw[->] (\xmin,0) -- (\xmax,0) node[above=2pt] {\xLabel};
\draw[->] (0,\ymin) -- (0,\ymax) node[below left] {\yLabel};
\draw(1, {5-10*sin(1.1 r)*exp(-0.4)}) node{$\bullet$} node[left=1mm]{P$_{1}$};
\draw (6, {5/36-1.667*sin(6.6 r)*exp(-2.4)}) node{$\bullet$} node[above right]{ P$_{2}$};
\end{tikzpicture}

% ==========================================
% Simulation numérique : exemples d'orbite d'un corps soumis à une force centrale $f(r)=\frac{k}{r^{p}}$ avec $p=2,5$ et $p=-0,5$.
% ==========================================
\begin{tikzpicture}[scale=0.9]
\begin{scope}
\begin{axis}[title={$f(r)=\frac{k}{r^{2}\sqrt{r}}$},
	xlabel={x},
	ylabel={y},
	xmin=-1.2,
	xmax=1.2,
	ymin=-1.2,
	ymax=1.2,
	xtick=\empty,
	ytick=\empty,
	extra y ticks={0},
	extra y tick labels={0},
	extra y tick style={grid=major},
	extra x ticks={0},
	extra x tick labels={0},
	extra x tick style={grid=major}]
	\addplot+[mark=none,smooth] table[x=x,y=y]{CentraleRK4p2.5.txt} node{$\bullet$};
	\draw [black,fill=gray] (axis cs:0,0) circle (4pt);
 \end{axis}
 \end{scope}
 \begin{scope}[xshift=8cm]
 \begin{axis}[
	 title={$f(r)=k\sqrt{r}$},
 	xlabel={x},
 	ylabel={y},
 	xmin=-1.2,
 	xmax=1.2,
 	ymin=-1.2,
 	ymax=1.2,
 	xtick=\empty,
 	ytick=\empty,
 	extra y ticks={0},
 	extra y tick labels={0},
 	extra y tick style={grid=major},
 	extra x ticks={0},
 	extra x tick labels={0},
 	extra x tick style={grid=major}]
	\addplot+[mark=none,smooth] table[x=x,y=y]{CentraleRK4racine-r.txt} node{$\bullet$};
	\draw [black,fill=gray] (axis cs:0,0) circle (4pt);
 \end{axis}
 \end{scope}
 \end{tikzpicture}

%======================================================
% Potentiel effectif dans le cas d'une interaction newtonienne attractive.
%======================================================
\begin{tikzpicture}[scale=1]
\begin{axis}[
	grid=major,
	axis lines=middle,% bottom,top
	inner axis line style={=>},
 	xlabel={$r$},
 	ylabel={$E_{\rm p,\, eff}$},
 	xmin=0,
 	xmax=7,
 	ymin=-2.1,
 	ymax=3,
 	xtick=\empty,
 	ytick=\empty,
 	extra y ticks={1,-1},
 	extra y tick labels={\small $E_{\textrm{m}}>0$,\small $E_{\textrm{m}}<0$},]
	\addplot+[mark=none,domain=0.4:7,samples=100]{2/(x*x)-4/x};
	\draw [gray](axis cs:0.45,1)--(axis cs:7,1)node[pos=0.5, above]{\small états non liés};
	\draw [gray](axis cs:0.6,-1)--(axis cs:3.4,-1)node[pos=0.5, above]{\small états liés};
	\draw[dashed] (axis cs:1,-2)node{•}--(axis cs:1,0)node[above]{$r_0$};
\end{axis}
\end{tikzpicture}

%======================================================
% Les différentes trajectoires képlériennes en fonction de l'excentricité $e$. On peut noter que les trajectoires se coupent lorsque $\theta-\theta_{0}=\frac{\pi}{2}$ ; dans ce cas $r=p$
%======================================================
\begin{tikzpicture}[scale=1]
\def \parametre {1.5};%parametre
\def \alphaM {160};%angle correspondant au point M
\def \alphaP {20};%angle correspondant au périgée%
\draw[ultra thin, dashed,rotate=20](-6,0)--++(8,0) node[pos=0.4,fill=white ,rotate=20]{\small axe de sym\'etrie};
\draw[->,ultra thin,gray] (-2.5,0)--++(5,0)node[below left]{$x$};
\draw[vecteur] (0,0)++(1.5,0) arc(0:\alphaP:1.5);
\draw ({\alphaP/2}:2) node[left]{$\theta_{0}$};
%L'hyperbole
\def \excentric {1.6};%excentricité
\def \gdaxe {\parametre/(\excentric*\excentric-1)};% grand axe a
\def \focale {\excentric*\gdaxe};% focale
\def \ptaxe {sqrt(\focale*\focale-\gdaxe*\gdaxe)};% petit axe b
 \draw[draw=white,double=black,very thick,variable=\t , domain=-92:132,samples=100] plot ({\parametre*cos(\t)/(1+\excentric*cos(\t-\alphaP))},{\parametre*sin(\t)/(1+\excentric*cos(\t-\alphaP))}) node[left]{$e>1$};
%%% la parabole %%%
\def \excentric {1};%excentricité
\def \focale {\parametre*0.5};
\draw[draw=white,double=black,very thick,variable=\t , domain=-110:150,samples=100] plot ({\parametre*cos(\t)/(1+\excentric*cos(\t-\alphaP))},{\parametre*sin(\t)/(1+\excentric*cos(\t-\alphaP))})node[left]{$e=1$};
%%% l'ellipse %%%
\def \excentric {0.7};%excentricité
\def \gdaxe {\parametre/(1-\excentric*\excentric)}  ;
\def \focale {\excentric*\gdaxe};
\def \ptaxe {sqrt(\gdaxe*\gdaxe-\focale*\focale)};
\draw[draw=white,double=black,very thick,variable=\t , domain=180:360,samples=50] plot ({\parametre*cos(\t)/(1+\excentric*cos(\t-\alphaP))},{\parametre*sin(\t)/(1+\excentric*cos(\t-\alphaP))});
\draw[draw=white,double=black,very thick,variable=\t , domain=0:180,samples=50] plot ({\parametre*cos(\t)/(1+\excentric*cos(\t-\alphaP))},{\parametre*sin(\t)/(1+\excentric*cos(\t-\alphaP))}) node[fill=white]{$e<1$};
\coordinate (M) at ({\parametre*cos(\alphaM)/(1+\excentric*cos(\alphaM-\alphaP))},{\parametre*sin(\alphaM)/(1+\excentric*cos(\alphaM-\alphaP))});
\draw (0,0) node{$\bullet$} node[below]{\small Foyer}--(M) node[above=4pt,fill=white]{M$(r,\theta)$}node[pos=0.5,fill=white]{$r$};
\draw[fill=white] (M) circle(0.1);
\draw[vecteur] (0,0)++(0.4,0) arc(0:\alphaM:0.4);
\draw ({\alphaM/2}:0.7) node[left]{$\theta$};
\end{tikzpicture}

% =======================================================================
% Trajectoire hyperbolique dans le cas d'une force newtonienne répulsive.
% =======================================================================
\begin{tikzpicture}[scale=1,decoration={markings,mark=at position 1cm with {\arrow[black]{stealth};}}]
\def \parametre {1.5};%parametre de l'hyperbole
\def \excentric {1.6};%excentricité
\def \alphaP {0};%angle correspondant au périgée
\def \alphaM {30};%angle correspondant au point M
\def \gdaxe {\parametre/(\excentric*\excentric-1)};% grand axe a=0,96
\def \focale {\excentric*\gdaxe};% focale=1,54
\def \ptaxe {sqrt(\focale*\focale-\gdaxe*\gdaxe)};% petit axe b=1,2
\def \dev{atan(\ptaxe/\gdaxe)};% angle des asymptotes dev=51,3°
\draw[thin, gray,<->] ({\gdaxe},{-\ptaxe})--++({-\ptaxe*\ptaxe/sqrt(\ptaxe*\ptaxe+\gdaxe*\gdaxe)},{-\gdaxe*\ptaxe/sqrt(\ptaxe*\ptaxe+\gdaxe*\gdaxe)})node[pos=0.5,fill=white]{\small $b$};
\draw[->,ultra thin,gray] (-2,0) --++(6,0)node[below left]{$x$};%axeOx
\draw[->,ultra thin,gray] (0,-1) --++(0,5)node[below left]{$y$};%axeOy
\draw[thin,dashed,variable=\t , domain=-1:3,samples=20] plot ({\t},{(\ptaxe/(\gdaxe))*\t});%asymptotes
\draw[thin,dashed,variable=\t , domain=-3:1.5,samples=20] plot ({-\t},{(\ptaxe/(\gdaxe))*\t});%asymptotes
\draw[thin,dashed,variable=\t , domain=-2:2.5,samples=20] plot ({-\t},{(\ptaxe/(\gdaxe))*\t-2});%asymptotes
\draw[vecteur] ({-\gdaxe},{\ptaxe}) arc(128.7:51.3:1.54);
\draw  (0,1.54) node[above]{$\Theta_{\rm{dev}}$};
\begin {scope}[shift={({-\focale},0)} ]
	\coordinate (M) at ({\parametre*cos(\alphaM)/(-1+\excentric*cos(\alphaM-\alphaP))},{\parametre*sin(\alphaM)/(-1+\excentric*cos(\alphaM-\alphaP))});
	\coordinate (F) at (0,0);
	\draw[postaction={decorate},thick,variable=\t , domain=-40:35,samples=100] plot ({\parametre*cos(\t)/(\excentric*cos(\t-\alphaP)-1)},{\parametre*sin(\t)/(\excentric*cos(\t-\alphaP)-1)}) node[right]{$\mathcal{C}'_{\rm h}$};
	\draw (0,0) node{$\bullet$} node[below]{\small Foyer}--(M) node[right=2pt,fill=white]{M$(r,\theta)$}node[pos=0.5,left]{$r$};
	\draw[fill=white] (M) circle(0.1);
	\draw[vecteur] (F)++(0.8,0) arc(0:\alphaM:0.8);
	\draw ({\alphaM/2}:1) node[right]{$\theta$};
\end{scope}
\end{tikzpicture}


\end{document}