Assignment 1 in APSC791

\documentclass[a4paper]{article}

\usepackage[english]{babel}
\usepackage[utf8]{inputenc}
\usepackage{amsmath}
\usepackage{graphicx}
\usepackage[colorinlistoftodos]{todonotes}

\usepackage{float}

\title{Clustering Coefficient for A $G_{n,p}$ Graph}

\author{Thomas McCauley and Amrita Lamba}

\date{\today}

\begin{document}
\maketitle


\section*{Problem 1}

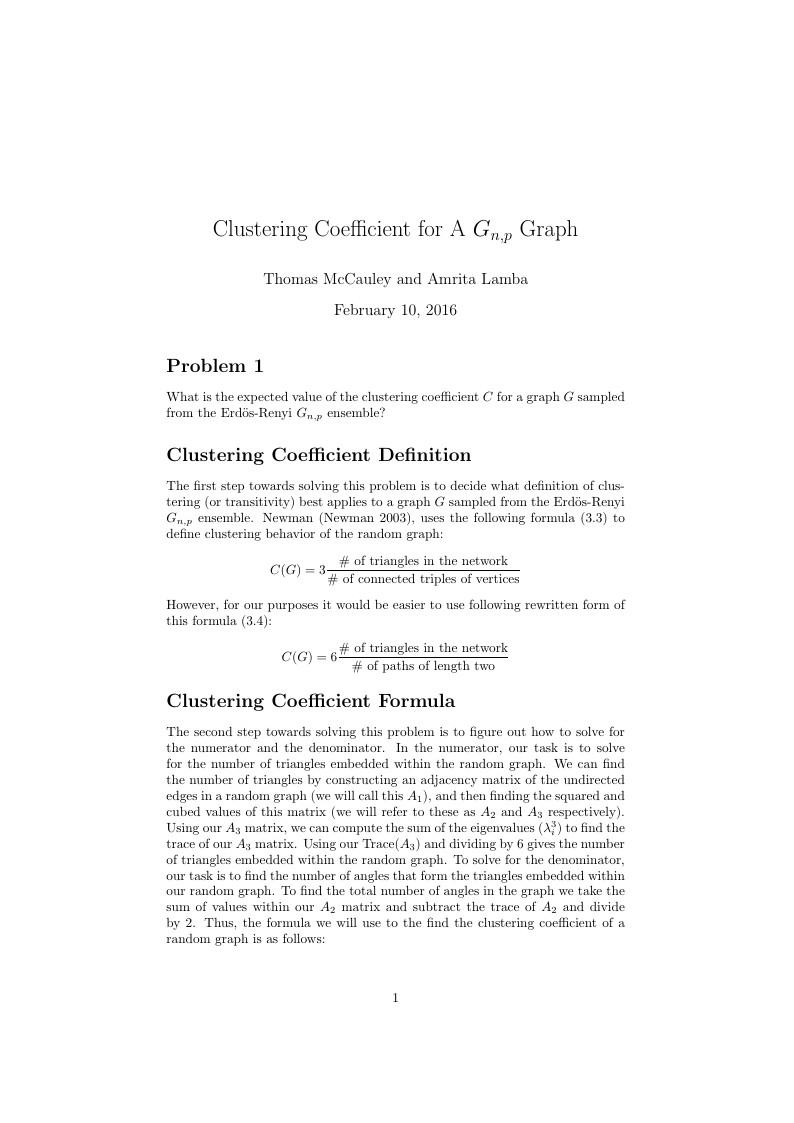
What is the expected value of the clustering coefficient $C$ for a graph $G$ sampled from the Erd\"os-Renyi $G_{n,p}$ ensemble?

\section*{Clustering Coefficient Definition}

The first step towards solving this problem is to decide what definition of clustering (or transitivity) best applies to a graph $G$ sampled from the Erd\"os-Renyi $G_{n,p}$ ensemble. Newman (Newman 2003), uses the following formula (3.3) to define clustering behavior of the random graph:
$$C(G) = 3\frac{\text{\# of triangles in the network}}{\text{\# of connected triples of vertices}}$$
However, for our purposes it would be easier to use following rewritten form of this formula (3.4):

$$C(G) = 6\frac{\text{\# of triangles in the network}}{\text{\# of paths of length two}}$$

\section*{Clustering Coefficient Formula}
The second step towards solving this problem is to figure out how to solve for the numerator and the denominator. In the numerator, our task is to solve for the number of triangles embedded within the random graph. We can find the number of triangles by constructing an adjacency matrix of the undirected edges in a random graph (we will call this $A_{1}$), and then finding the squared and cubed values of this matrix (we will refer to these as $A_{2}$ and $A_{3}$ respectively). Using our $A_{3}$ matrix, we can compute the sum of the eigenvalues $({\lambda_i^3}$) to find the trace of our $A_{3}$ matrix. Using our Trace($A_{3}$) and dividing by 6 gives the number of triangles embedded within the random graph. To solve for the denominator, our task is to find the number of angles that form the triangles embedded within our random graph. To find the total number of angles in the graph we take the sum of values within our $A_{2}$ matrix and subtract the trace of $A_{2}$ and divide by 2. Thus, the formula we will use to the find the clustering coefficient of a random graph is as follows:

$$Number of triangles = \frac{\sum_i{\lambda_i^3}}{6}$$
$$Number of bi-angles = \frac{\text{Sum$A_{2}$-Trace$A_{2}$}}{\text{2}}$$
$$C(G) = \frac{\sum_i{\lambda_i^3}}{\text{Sum$A_{2}$-Trace$A_{2}$}}$$

\section*{Sage Code}
Solving for Numerator: The number of triangles in an adjacency matrix can be derived by summing up its cubed Eigenvalues. To determine the number of triangles, we derived the numerator using the following Sage code:
\begin{verbatim}

N=9

#cubes and sums up the eigenvalues for the matrix, providing us with the numerator for the clustering coefficient
g = graphs.CompleteGraph(N)
L = g.adjacency_matrix()
print(L)
g.show()
LE = L.eigenvalues()
print(LE)
LE3 = [i^3 for i in LE]
print(LE3)

numerator = sum([i*1 for i in LE3])
print(numerator)


#creates the denominator using the sum of the squared values from the adjacency matrix minus the
#trace of the squared values from the adjacency matrix, all of that divided by 2 to account for redundancy
L2 = L**2
print(L2)
TL2=L2.trace()
print(TL2)

SL2 = sum(sum(L2))
denominator = (SL2 - TL2)
print(denominator)

#Full forumla for the expected number of triangles in a graph
fullformula=numerator/denominator
print(fullformula)

\end{verbatim}

\section*{Proof}

To test our code we compared the results generated using the following built-in functions in Sage:
\begin{verbatim}
e.g: (graphs.RandomGNP(N,p).cluster_transitivity()
\end{verbatim}

We computed transitivity results for parameters applied to a $G_{n,p}$ graph and compared the output of the cluster transitivity function against our own function. We used 10 values of nodes $n$ and 10 values of probability $p$ for a total of 100 different graphs. Our code held up, with variability decreasing as $p$ increased.

\section*{References}

Newman, M. E. (2003). The structure and function of complex networks. SIAM review, 45(2), 167-256.

\end{document}


\documentclass{article}
\usepackage{listings}
\begin{document}
\lstset{language=Sage}
\begin{lstlisting}